FULWELL INFANT SCHOOL ACADEMY
KS1 ASSESSMENT INFORMATION 2016
This group of children entered nursery with skills in line with what was expected nationally. Personal, social and emotional development was a strength although their independence and basic skills in writing and number were a particular concern. There were an additional 10 children joined this year group after their school start. In some cases, this was in response to perceived failings in neighbouring schools. From this average starting point they have made consistently good progress to reach standards above those of their peers nationally.
Factors influencing results
- 86 children in the year group
- 10 children with SEN – 2 with EHCP and 8 at school support (10% SEN)
- 16 children accessing PP funding (18.6%) 12 FSM (14%)
- 1 looked after child admitted September 2015
- 1 previously looked after child
- 4 EAL children (5%)
- 32 summer born children (37%)
- 40 boys (46 girls) 47% boys and 53% girls
ATTAINMENT and STANDARDS
APS SCORES
SCHOOL 2014
ALL SUBJECTS
17.0
READING
WRITING
MATHS
1 year judgement
3 year judgement
% LEVELS
Greater Depth 2016
READING
36
WRITING
28
MATHS
30
NOTES
32
Summer born
READING
3.3
WRITING
3.3
MATHS
3.3
ALL
3.3
Reading
Writing
Mathematics
BELOW
EXPECTED
GREATER DEPTH
10 (11%)
45 (52%)
31 (36%)
12 (14%)
50 (58%)
24 (28%)
10 (11%)
50 (58%)
26 (30%)
STARTING POINTS (2012)
RESULTS 2016
STANDARDS 2016
National
SCHOOL 2015
National
SCHOOL
2016
National
15.9
17.1
16.1
87%
17.5
16.5
17.6
16.6
88%
16.5
15.1
16.4
15.3
86%
17.0
16.2
17.3
16.4
88%

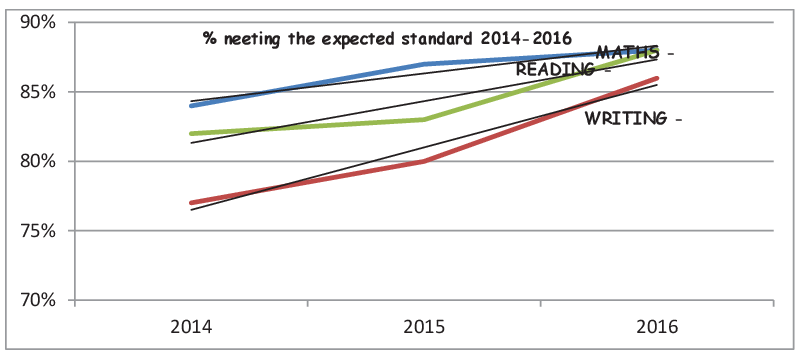
ATTAINMENT TRENDS
2014-2016
(% of children at/above national expectations)
SCHOOL DATA FOR 2016: (Percentages)
ATTAINMENT OF GROUPS 2016: (Expected +)
Expected + 2016
88
86
88
L3+ 2015
(Nat 2015)
40
28
41
L2+ 2015
(Nat 2015)
94
92
97
L3+ 2014
(Nat 2014)
41
28
28
L2+ 2014
(Nat 2014)
97
92
97
(86)
(92)
(31)
(16)
(24)
(88)
(93)
(32)
(18)
(26)
NATIONAL COMPARISONS GROUP ATTAINMENT 2016
The results for year 2 progress are in the table below.
4
LA
3.8
4.0
4.0
3.9
11
G&T
3.1
3.2
3.2
3.2
4
E&L
3.6
3.8
3.0
3.3
10
SEN
4.3
4.2
4.1
4.2
11
PP
3.2
3.1
3.2
3.2
86
ALL PUPILS
3.2
3.3
3.3
3.3
40
BOYS
3.2
3.3
3.2
3.2
46
3.2
3.3
3.3
3.3
PROGRESS MEASURES 2014-2016
Year 2
PROGRESS JUDGEMENT
YEAR 1
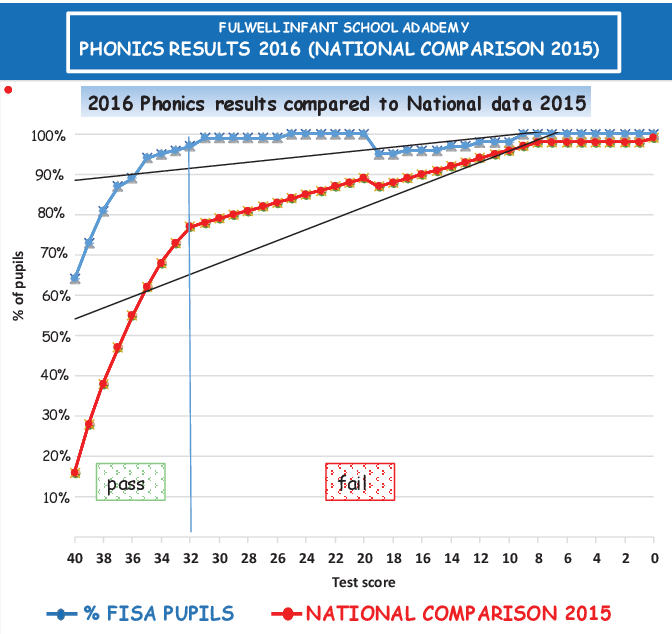
phonics scores 2016
Pass mark is
32/40

% FISA PUPILS
40
64%
16%
39
73%
28%
38
81%
38%
37
87%
47%
36
89%
55%
35
94%
62%
34
95%
68%
33
96%
73%
32
97%
77%
31
99%
78%
30
99%
79%
29
99%
80%
28
99%
81%
27
99%
82%
26
99%
83%
25
100%
84%
24
100%
85%
23
100%
86%
22
100%
87%
21
100%
88%
20
100%
89%
% FISA PUPILS
19
90%
18
91%
17
92%
16
93%
15
94%
14
94%
13
94%
12
94%
11
94%
10
94%
9
94%
8
94%
7
94%
6
94%
5
94%
4
100%
94%
3
100%
94%
2
100%
94%
1
100%
94%
0
100%
95%
100%
100%
100%
100%
100%
100%
100%
100%
100%
100%
100%
100%
100%
100%
100%
This is a measure of the ability to segment and blend rather than comprehend a text as in the year 2 reading tests. The children did exceptionally well this year with only 3 children scoring below 32 marks – the pass mark in previous years.
Wendy Angus 1st June 2016